Pushpal Kawara

I am the bridge that turns data into smarter business decisions.

↳ For hiring & professional opportunities. Prefer not to fill the form? You can also access my resume via LinkedIn.

Pushpal Kawara
Pushpal Kawara

About

Professional Overview

I turn business data into structured reporting and analysis that helps teams understand performance, identify problems, and make better decisions. With 1 year of experience across user behaviour, product, marketing, and operational analytics, I have worked with diverse datasets to build reporting systems, dashboards, and automated workflows that make information easier to act on.

My approach starts with understanding the business question, defining the right KPIs, working through the data, and using analysis to identify trends, gaps, and root causes. In my previous experience, this included improving player engagement by 15%, increasing paid ROAS by 20%, reducing ad-hoc reporting requests by 40%, and saving 10 hours per week through reporting automation.

Education

Bachelor of Technology — Computer Science & Engineering
RTM Nagpur University | 2020–2024 | CGPA: 7.38/10

Capabilities

Statistics & Mathematics

Descriptive Statistics Central Tendency Dispersion

Spreadsheets

Advanced Excel Power Query Pivot Tables XLOOKUP VBA Macros Google Sheets

Business Intelligence

Power BI DAX Data Modeling Dashboard Development Tableau Looker Studio KPI Reporting

SQL & Databases

SQL SQL Server PostgreSQL Database Structuring Star Schema

Python & Data Analysis

Python Pandas NumPy Matplotlib Exploratory Data Analysis (EDA)

Automation

Excel Automation Python Automation Google Apps Script AppSheet

Marketing Analytics

Campaign Performance Analysis ROAS CAC CPA LTV CTR CPC GA4 Google Ads Meta Ads AdMob

Data & Analytics

Data Cleaning Data Validation KPI Analysis Trend Analysis Root Cause Analysis Funnel Analysis Cohort Analysis Retention Analysis Conversion Analysis

Experience

Data Analyst

MindYourLogic Studios Private Limited | Nagpur, India

1 Year

Analytics across user behaviour, product, marketing, and operational data. Built reporting systems, dashboards, and automated workflows to help teams understand performance and make faster decisions.

  • Analyzed user sessions, retention cohorts, and event funnels across mobile and web games.
  • Evaluated paid campaign performance across Meta Ads, Google Ads, and AdMob using key marketing metrics.
  • Built marketing tracking dashboards with Google Sheets, Apps Script, and Looker Studio, reducing ad-hoc reporting requests by 40%.
  • Automated reporting workflows using Excel VBA and Power Query, saving 10 hours per week.

Selected Work

Three projects showing how I approach business problems — from understanding the context to turning data into decision-ready insights.

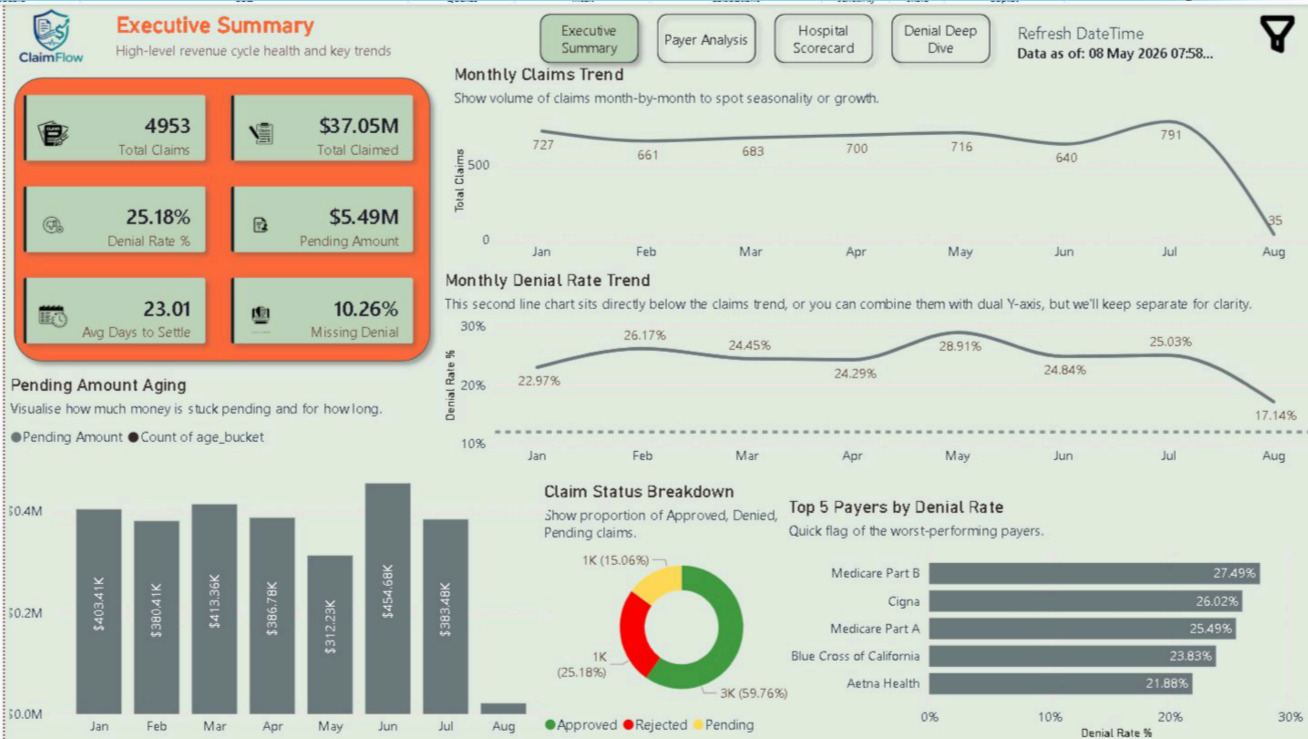
ClaimFlow dashboard preview

ClaimFlow — Revenue Cycle & Claims Recovery Analytics

Healthcare Revenue Cycle / Claims Analytics

PythonSQL ServerPower BIDAX

Healthcare claims teams need visibility into denials, aging claims, payer performance, and recovery opportunities. This project connects claims data across providers and payers to help teams identify where attention is needed and prioritize recovery actions.

Key Insights

  • Denial patterns varied significantly across payers.
  • Aging revealed high-value claims requiring immediate attention.
  • Appeal performance highlighted opportunities to prioritize recovery efforts.
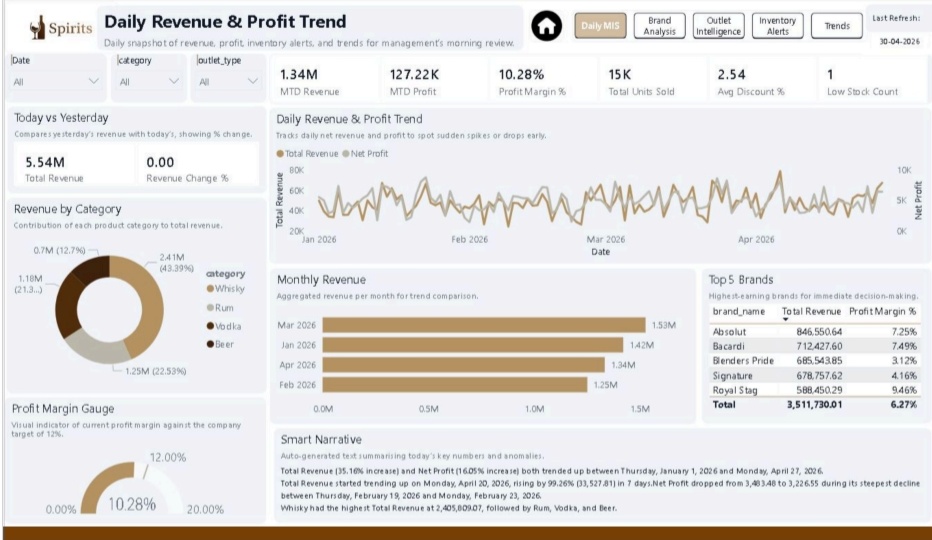
HS Oberoi dashboard preview

HS Oberoi — Distribution & Inventory Intelligence

Distribution / Sales / Inventory / Business Intelligence

PythonSQL ServerPower BIDAX

A connected view of sales, profitability, outlet performance, and inventory to identify margin pressure, stock risks, and demand patterns across a spirits distribution business.

Key Insights

  • Discounts above 8% created significant margin pressure across four high-revenue brands.
  • Retail channels generated 55% higher net profit than bar channels.
  • Four critical low-stock products required approximately ₹1.2L in reorder capital.
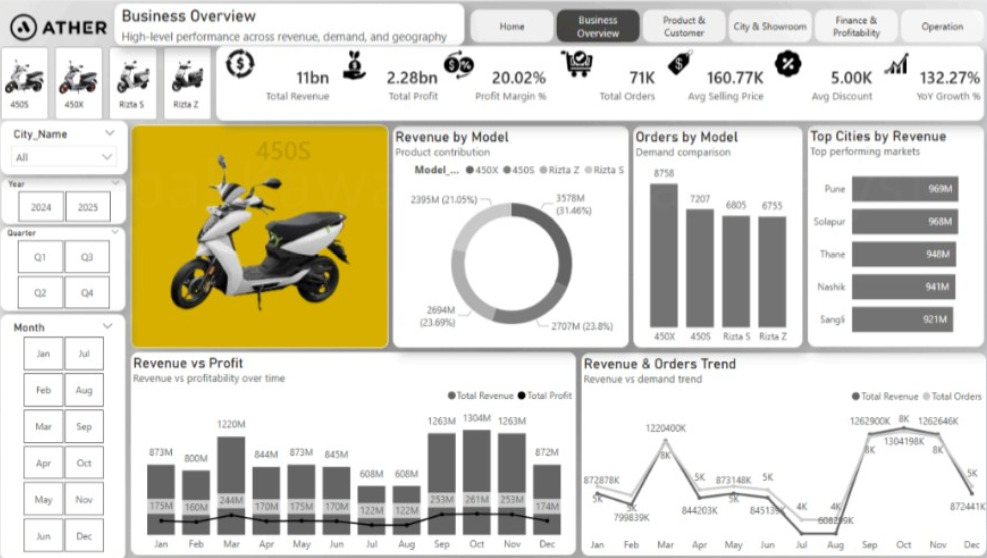
Ather Energy dashboard preview

Ather Energy — EV Sales & Operations Intelligence

Electric Vehicle / Sales / Customer / Operations Analytics

PythonSQL ServerPower BIDAX

A connected view of sales, profitability, customer payments, and delivery performance to understand where revenue is concentrated and where operational issues require attention.

Key Insights

  • The 450X generated ₹3.58bn in revenue and led the lineup by revenue and orders.
  • Financing reached 47.9% penetration, with financing and split-payment orders contributing close to 70% of total revenue.
  • 37.2% of orders were delivered later than the on-time target, with the issue pointing to showroom-level logistics.

Contact

Have a data problem? Let's talk.

Connect

For opportunities, referrals, collaborations, projects, or business inquiries.